A wizard, not a blank prompt
Pick your file, your date column, and the columns worth grouping by. It runs in the background.
A free little tool from the studio
Point it at a spreadsheet. It hands back stats, charts, group-by tables, correlations, and an outlier report — all on your own machine.
macOS · Python 3.12 · No account
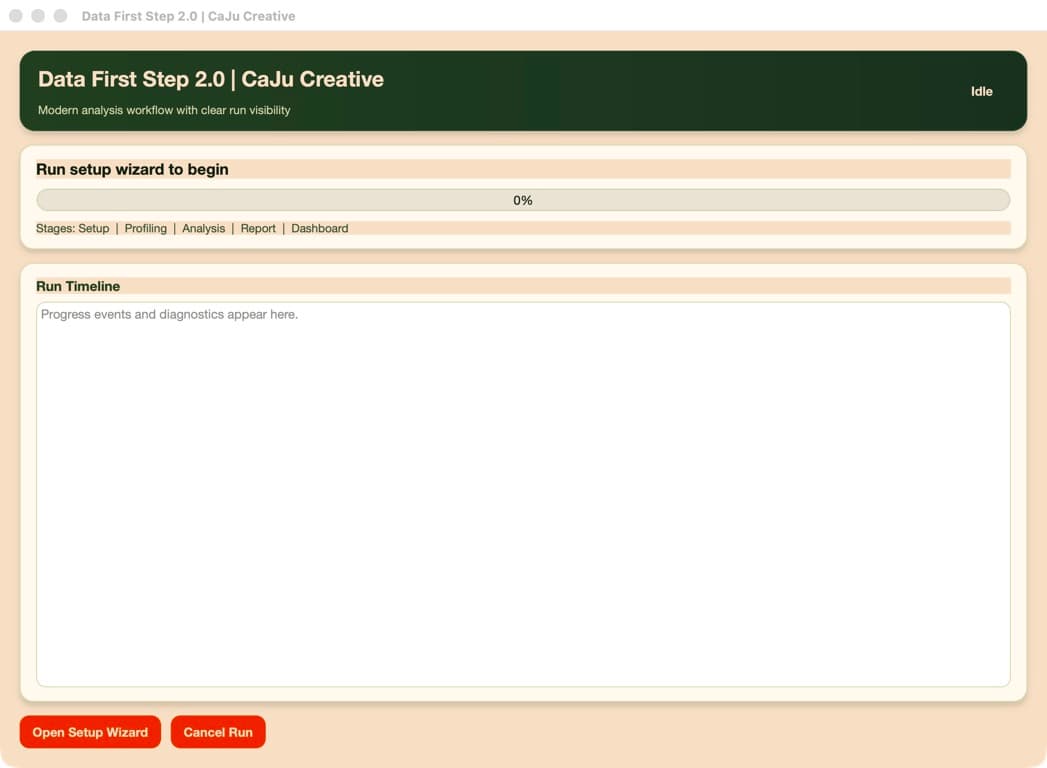
Start with a spreadsheet, follow the run as it profiles and analyzes the data, then keep the resulting CSV, XLSX, and PNG files in a folder you own.
Pick your file, your date column, and the columns worth grouping by. It runs in the background.
Distributions, comparisons, correlation heatmaps, and an outlier report — drawn and saved for you.
No account, no upload, no telemetry. Run a whole analysis with the Wi-Fi off.

Meet Stan · Optional · Offline
Ask him about a column — tell me about revenue — and he answers from the run you have open, only from that run, and points back at the file he read it in.
I will send the install link, and a note when there is a new version or a Windows build. Nothing else.
Needs macOS and Python 3.12 · Reads CSV and XLSX · No Windows build yet
No. Python has to be installed — the instructions walk you through it — but the program itself is a normal window with buttons.
Expected — it is not notarized. Move the archive out of Desktop or iCloud before unzipping, then open it from Applications.
Me, at caju@caju-creative.com. Bug reports are welcome — that is the trade for it being free.